
Appearance
AdminReporting & analytics
The Reporting sidebar group is the data side of SkilSure. It splits into three jobs: review work (submissions queue), read dashboards (pre-built analytics), and build & export reports (custom reports, gap analysis, batch export).
Content Submissions — the review queue
Every piece of work a user submits lands here. It's where reviewers, mentors, and admins triage and approve.
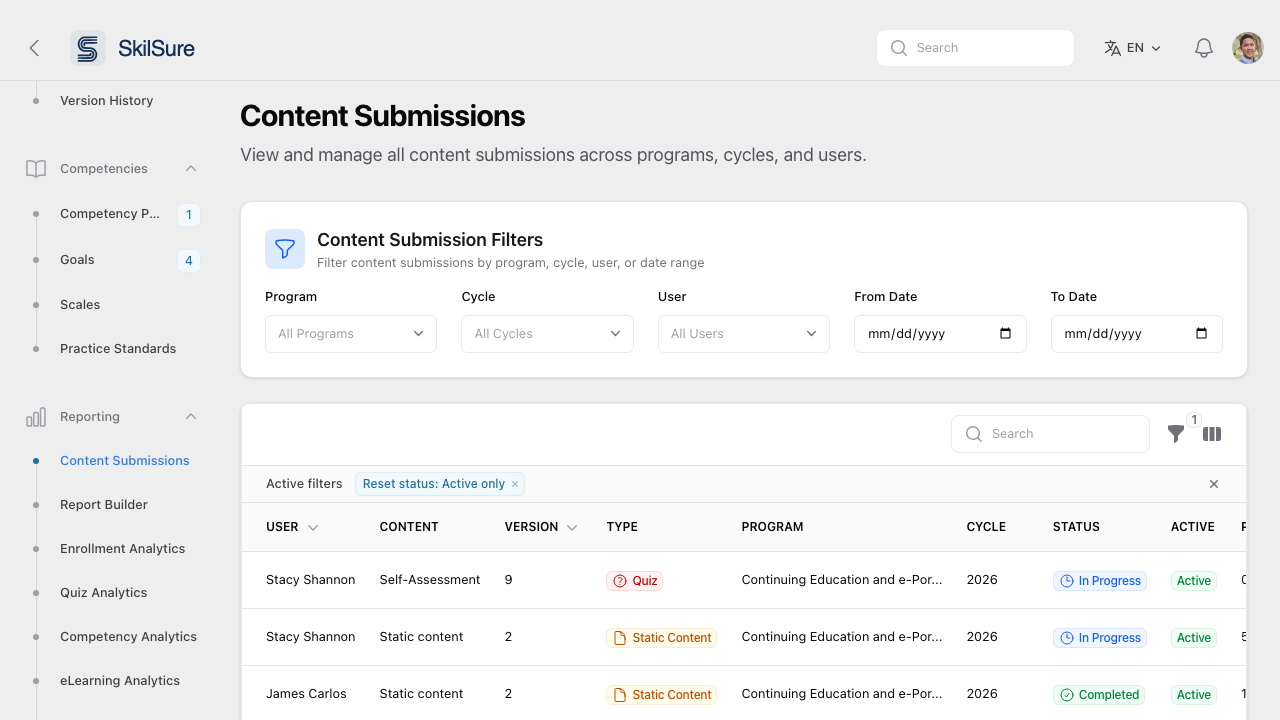 Content Submissions. Filter by program, cycle, user, or date range; status badges show what's In Progress, Submitted, or Completed.
- Filters at the top scope the table — useful when you only care about the current cycle.
- The table shows User, Content, Version, Type (Quiz, Static Content, Form, etc.), Program, Cycle, Status, and Active flag.
- Click a row to open the submission, review it, and approve, reject, or return it for revision.
- For Learning Portfolio and Activities submissions, the detail view renders the work read-only, exactly as the user sees it: a portfolio step shows its selected goals (each with all phases), a single goal-phase row shows that whole goal, and an activities submission lists every logged activity. Files the user uploaded are downloadable straight from the detail view.
- Portfolio goals, and each phase's entries within a goal, read oldest-first here and in this view's CSV export — the same order as the user's own view. See Goals → View a goal.
Pre-built analytics dashboards
Six domain dashboards under Reporting give you ready-to-read views — no setup required.
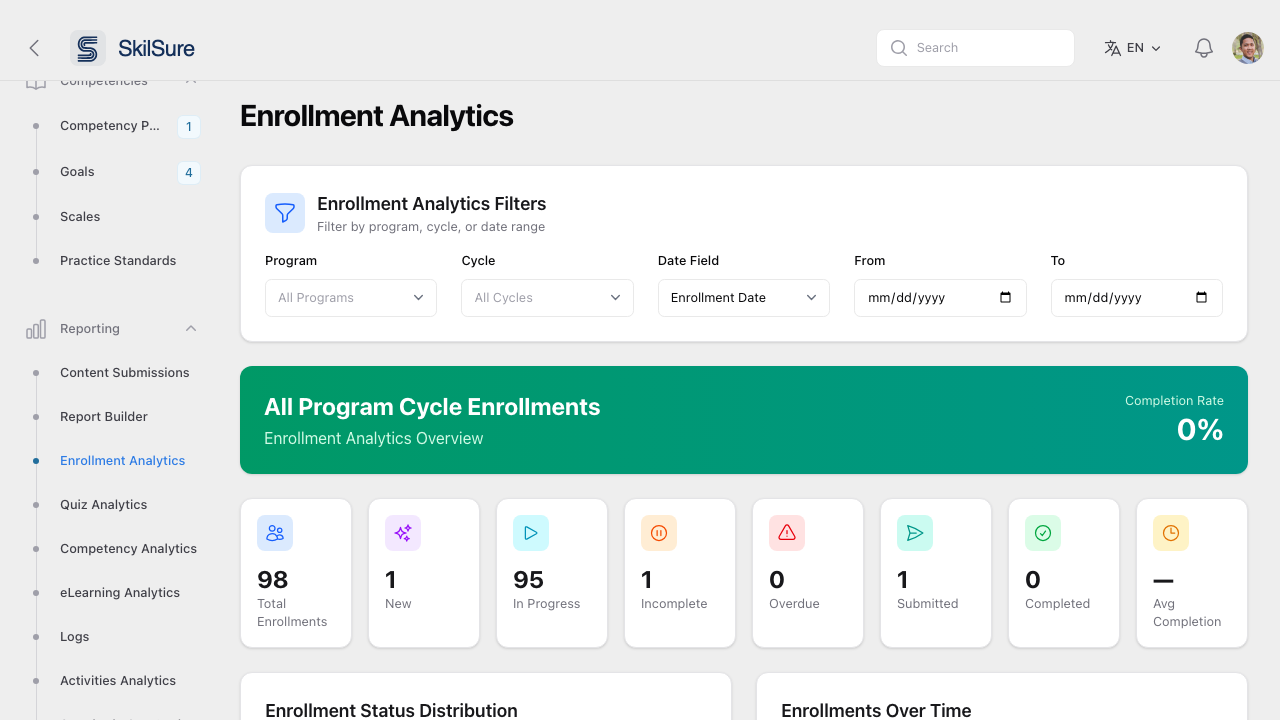 Enrollment Analytics — KPI tiles plus charts for status distribution and enrollments over time.
- Enrollment Analytics — totals, status mix (New / In Progress / Incomplete / Overdue / Submitted / Completed), completion rate, and enrollments over time.
- Quiz Analytics — attempt counts, pass rates, score distribution.
- Competency Analytics — how users are performing against the competencies the program maps to.
- eLearning Analytics — engagement with SCORM and other eLearning content.
- Activities Analytics — volume and approval status for Activity-type submissions (e.g. CPD activities).
- Forms Analytics — how people answered each field of a form.
All six share the same filter pattern at the top: Program, Cycle, and a date range. The Date Field selector on Enrollment Analytics lets you choose whether the date range applies to enrollment date, completion date, or deadline.
Enrollment Analytics
Enrollment Analytics counts program cycle enrollments: one per user per cycle. Enrollments that have been deleted are not counted.
- Total Enrollments is every enrollment matching the filters.
- The status tiles (New, In Progress, Incomplete, Overdue, Submitted, Awaiting Submission) each count enrollments in one status. See Enrollment statuses for what each one means.
- Submitted is the normal finished status. Awaiting Submission counts enrollments whose steps are all done but whose user still has to press Submit. It stays at 0 unless the program definition has Require completion submission turned on.
- Completion Rate = (Submitted + Awaiting Submission) ÷ (Total Enrollments − Exempt). Exempt users are excused from the requirement, so they count on neither side.
- To see who hasn't finished, use the Overdue and Incomplete tiles, then filter the table at the bottom of the page by that status.
Quiz Analytics
Pick a quiz to see how its attempts went. The tiles count different things, so they won't always add up to one another:
- Enrollments counts the quiz's submission records, not people. A user gets a new record each time they start a new version of the quiz, or when they are re-enrolled, so one user can have several. Compare it with Unique Users, not with Enrollment Analytics.
- Completions counts submitted attempts. Total Attempts also counts attempts that were started but never submitted.
- Unique Users counts users with at least one submitted attempt.
- Average Score and Passing Rate are calculated over submitted attempts, not users.
- The pass/fail chart places each user once, by the first attempt they passed on: Passed 1st, 2nd or 3rd+ Attempt. Failed All Attempts means the user has submitted at least one attempt and hasn't passed any yet. It includes users who still have attempts left. The chart doesn't list the users behind each group. To find them, export User Responses (one row per attempt) and look for users who have no row with a passing Result.
Why the Program filter can lower the Enrollments count
Quiz Analytics keeps attempts from enrollments that were later deleted (for example, a user who was withdrawn and re-enrolled), so nobody's results disappear. With no Program selected, Enrollments includes those records, plus any from other programs that use the same quiz. Selecting a Program narrows the count to that program's current enrollments. The attempt figures narrow only by program, so they can change much less than Enrollments does, or not at all.
Test accounts
Deleting a test user's enrollment does not remove their past attempts from Quiz Analytics. If the account is also in a nightly data import, the next run re-enrolls it. To keep test accounts out of your numbers, remove them from the import file or exclude them under Who to enrol.
Activities Analytics
The Activities Analytics table lists every activity submission. Any custom columns configured on the activities content (see Configure an activities module) appear here too, and a Create Date column is available from the column manager (hidden by default).
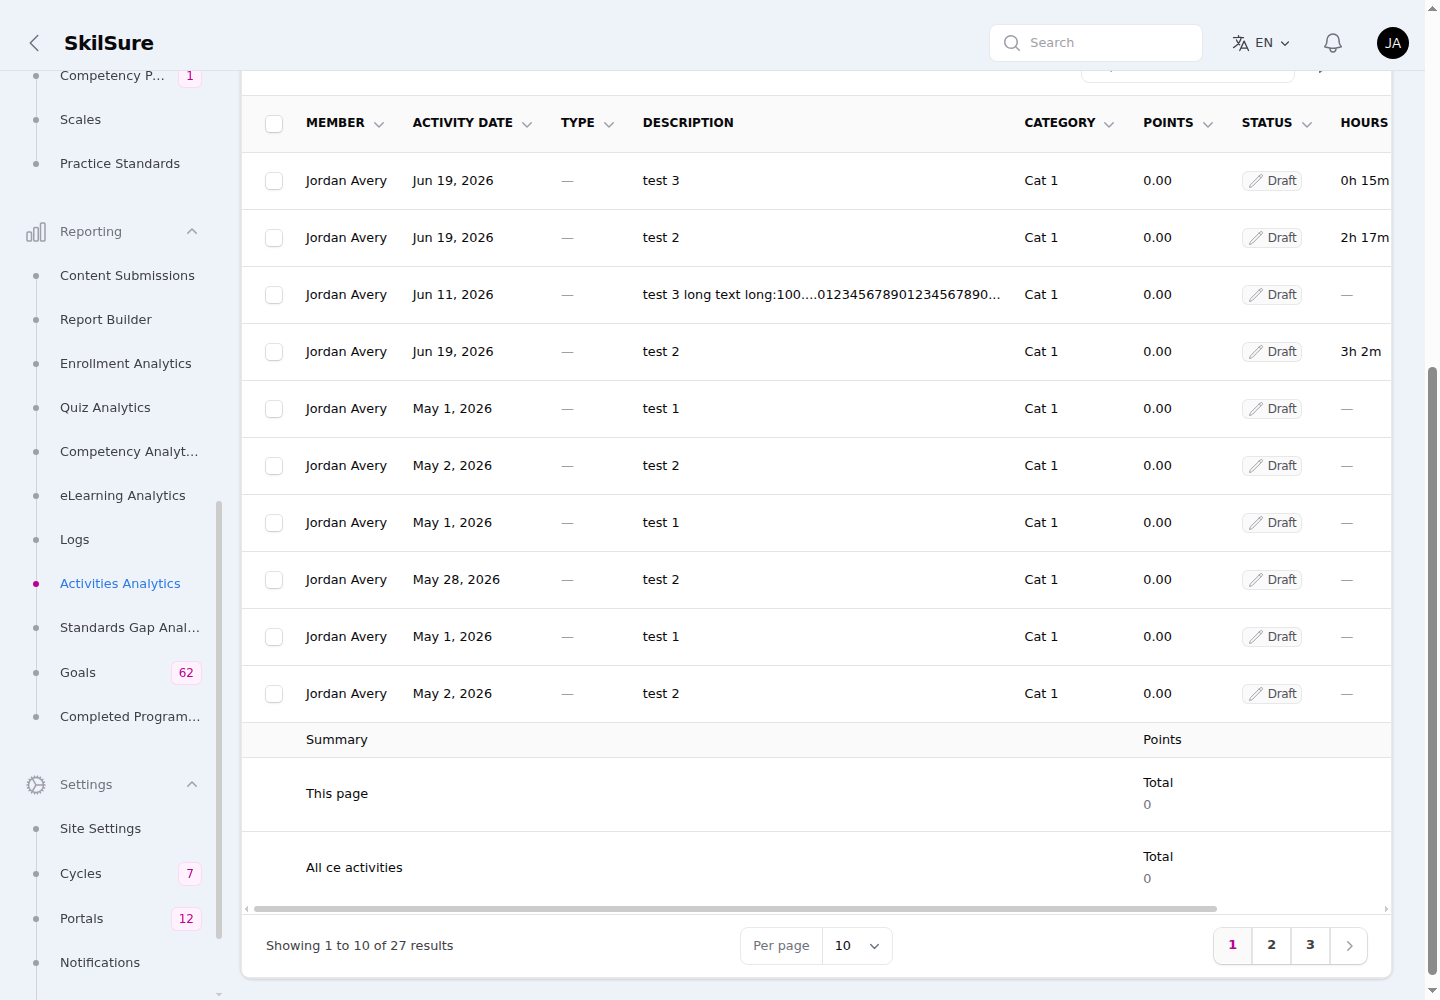 Activities Analytics. The Hours column here is a custom column defined on the activities content.
The Member column shows each user's member number on a second line under their name. The table Search box matches the user's name or member number, so you can type a full or partial member number to find one user's activities.
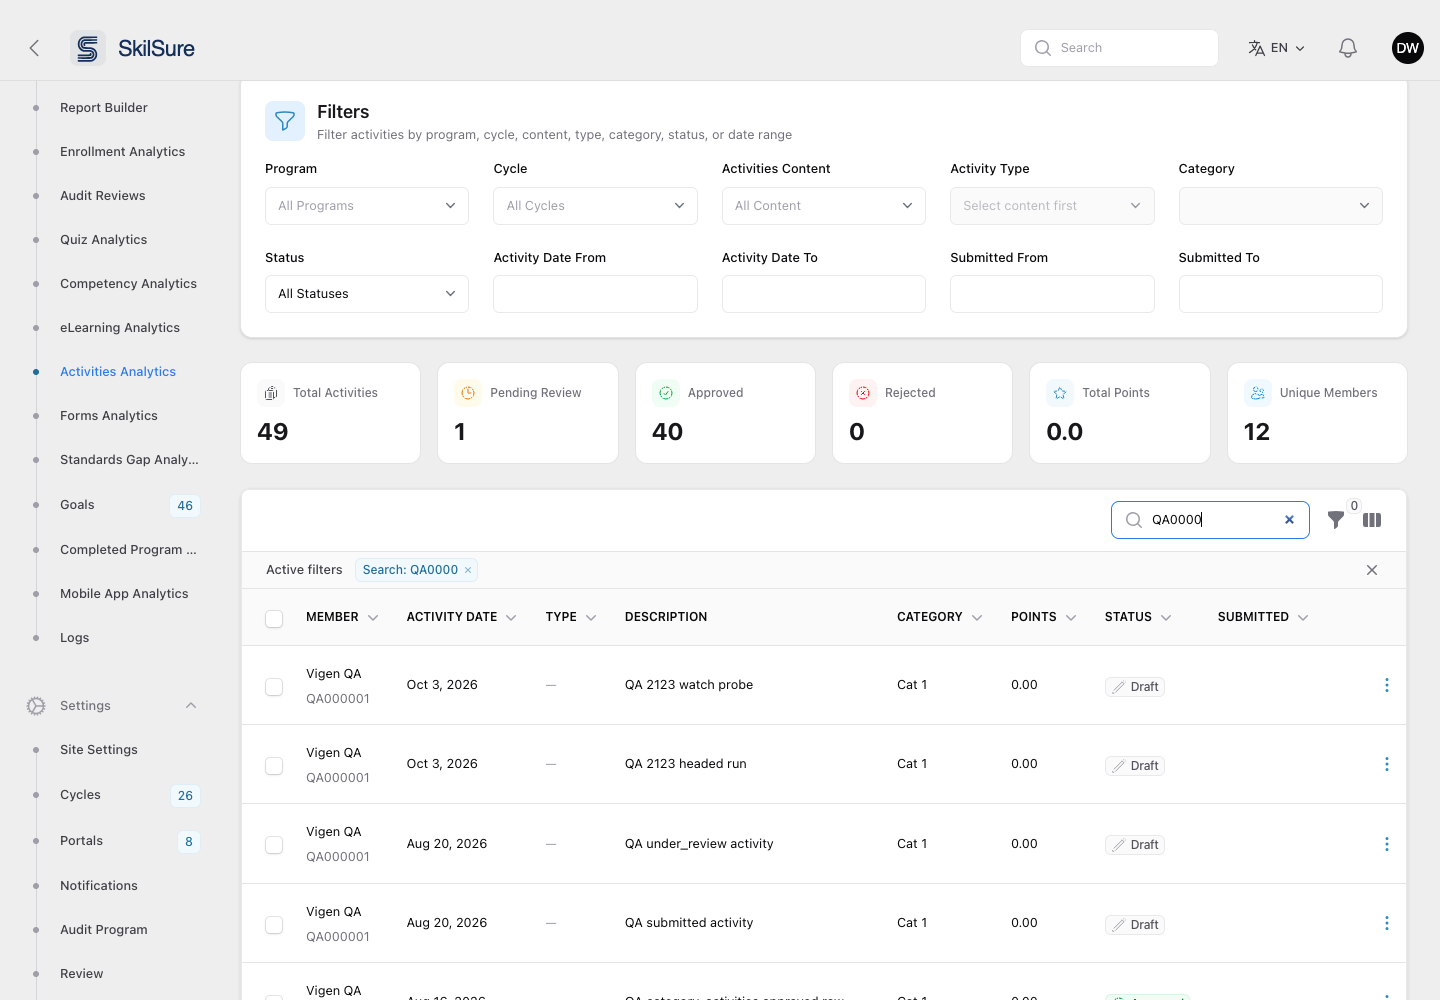 Searching by member number. The matching member number appears under each user's name.
Click View on any row to open the activity — the same detail view the user sees, plus an admin-only Member line and (for reviewed activities) a Review History block.
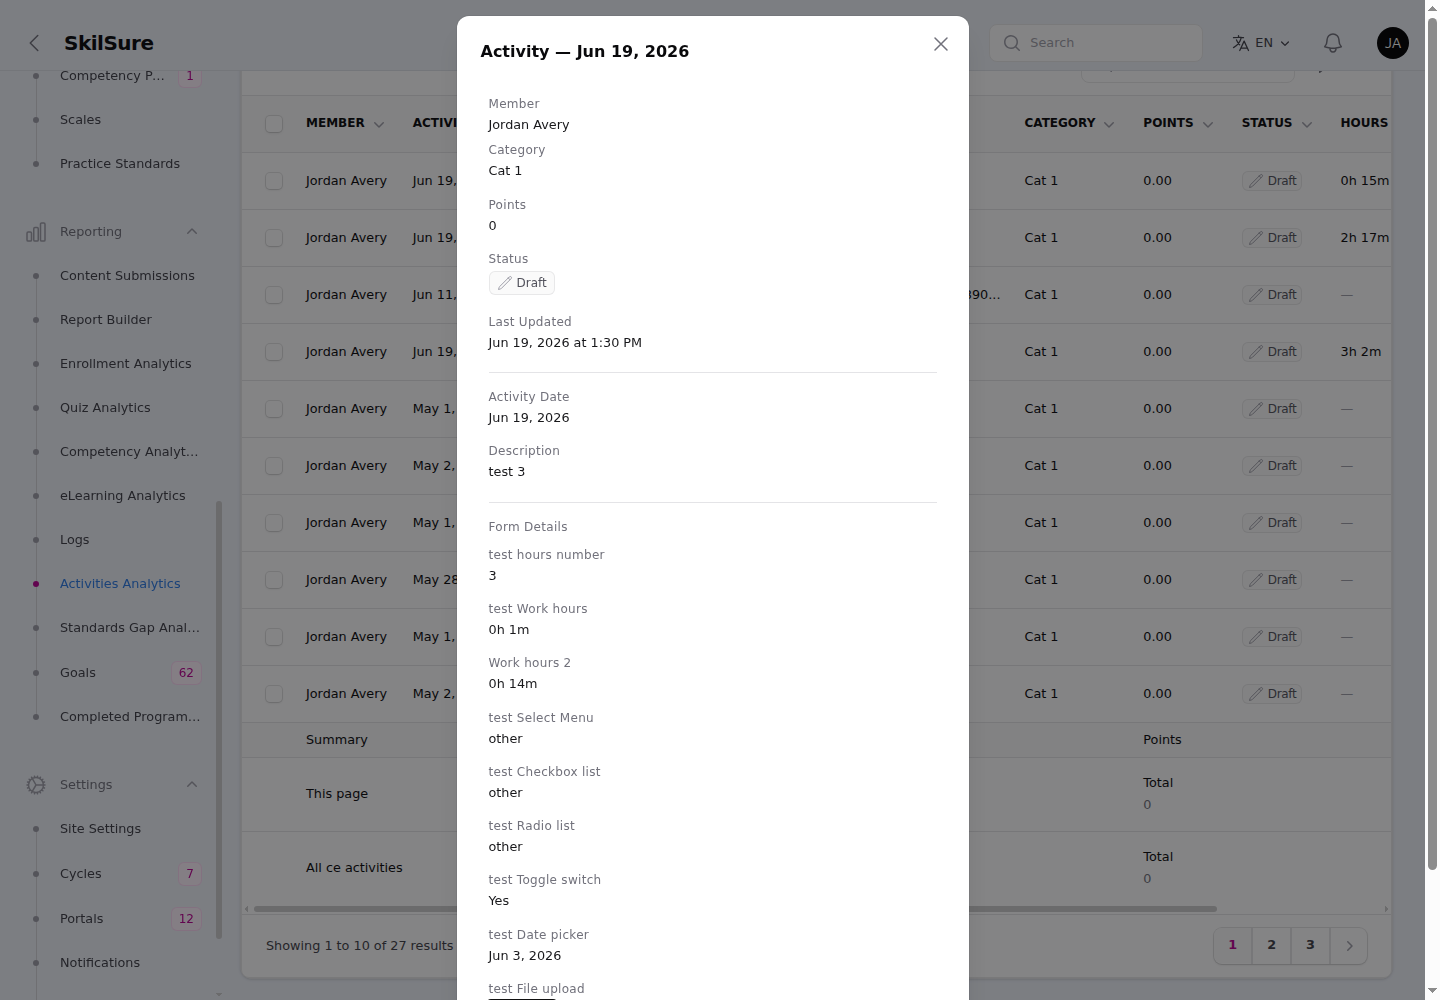 The View modal mirrors the user's activity view and adds the Member line for admins.
Review activities
Activities Analytics opens on All Statuses. To work through the activities waiting for a decision, set the Status filter to Under Review. This option covers every activity that is still pending review, and the Under Review summary card counts the same activities.
Open a row's Actions menu (⋮) and choose Review to open the Review Activity page. Review appears only on activities that are under review. Approve, Reject and Change category are also available directly from the menu if you don't need to open the activity. Each one appears only if your role has its permission (see Who can approve, reject or change category).
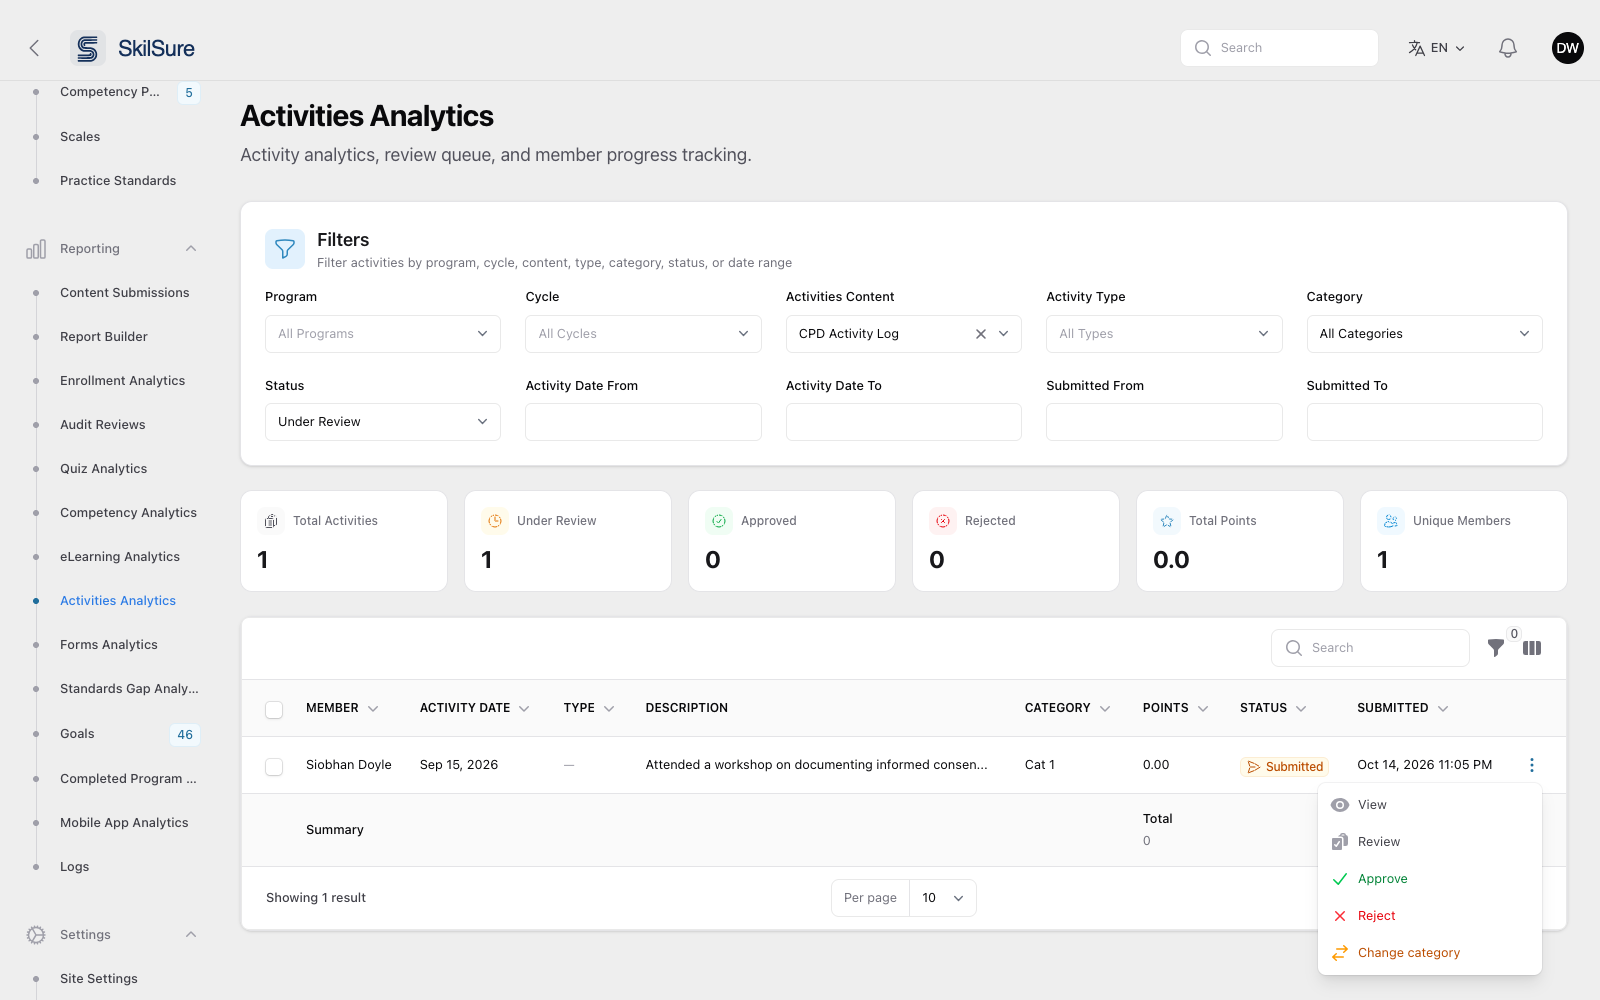 Activities Analytics, Status set to Under Review. The row menu's Review action opens the Review Activity page.
The Staff Review panel at the top of the page shows the user, their member number and email, the activity type and date, the status, category, points and when the activity was submitted. Its buttons record your decision:
- Approve: approves the activity. A comment is optional.
- Reject: rejects the activity. A reason is required.
- Change category: moves the activity to another category, with an optional comment. The activity stays under review, so you can still approve or reject it afterwards.
Below the panel, the Activity section shows the user's activity form with their answers.
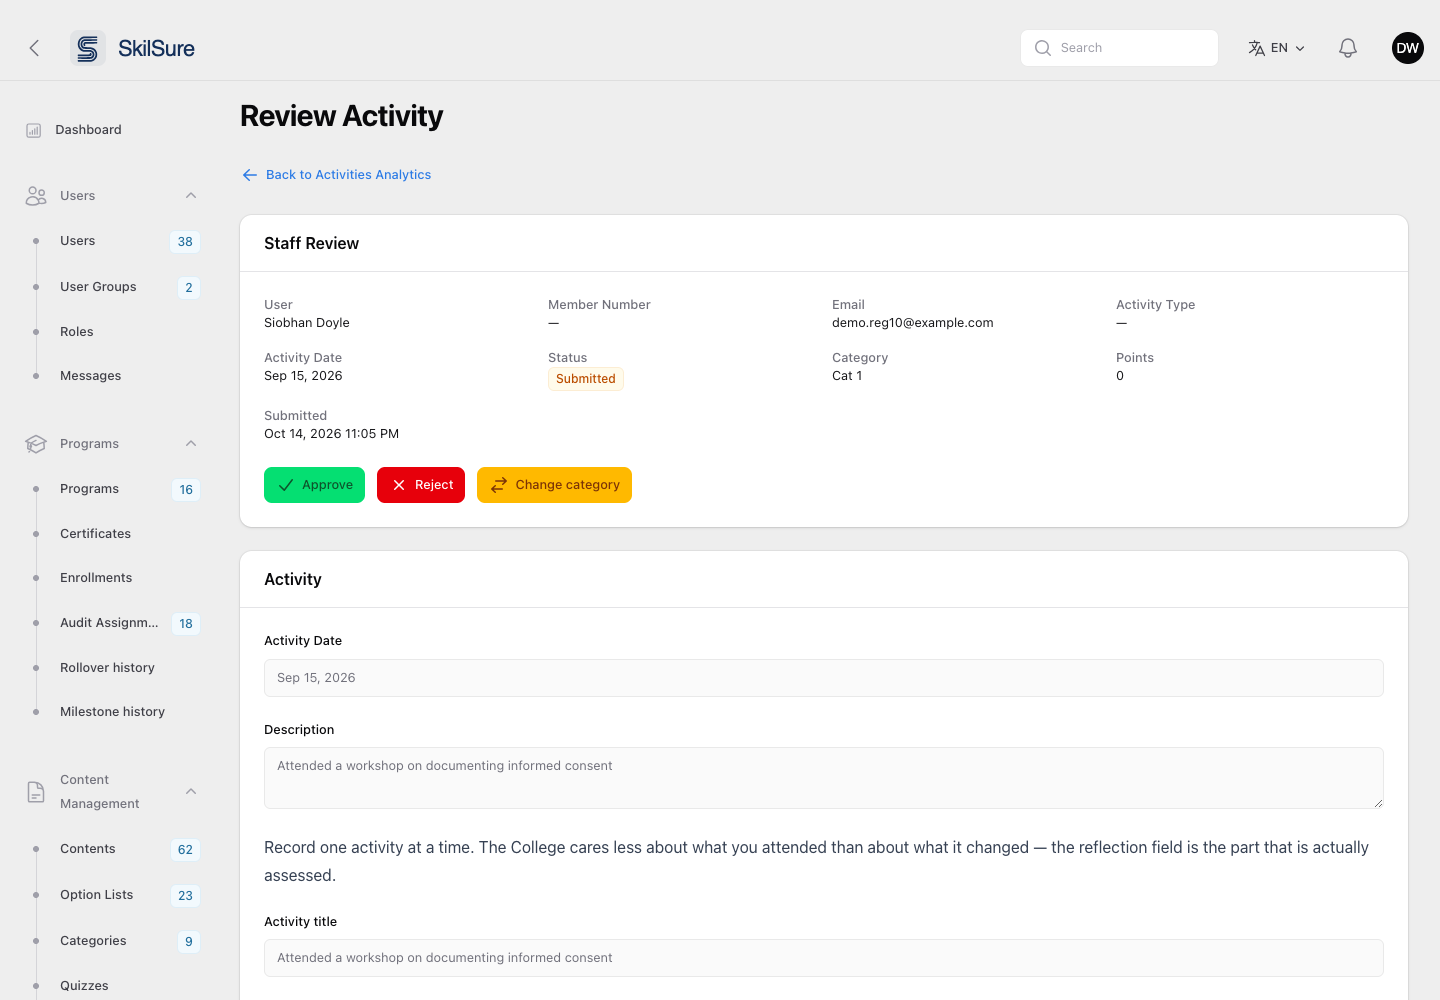 The Review Activity page. This administrator cannot edit activities, so the form is read-only.
Every decision is added to the activity's Review History. After Approve or Reject, you return to Activities Analytics with the same filters still applied, so you can move on to the next activity. Back to Activities Analytics keeps your filters too.
Who can approve, reject or change category
Opening Activities Analytics lets you view, filter, export and open the Review Activity page. It does not let you decide an activity. Each decision needs its own role permission:
| Permission | What it allows |
|---|---|
| Approve or Reject a User's CE Activity | Approve and Reject in a row's Actions menu and on the Review Activity page. |
| Approve or Reject CE Activities in Bulk | Approve Selected and Reject Selected after ticking rows in Activities Analytics. |
| Change a User's CE Activity Category | Change category in a row's Actions menu and on the Review Activity page. |
The three are independent: none of them includes another. A role without any of them sees only View and Review in the row menu, cannot select rows for bulk actions, and sees no decision buttons on the Review Activity page.
The Super Admin, Admin and Tenant Admin roles have all three. No other role has them, including Manager. To let another role make decisions, open Users → Roles, edit the role, and tick the permissions on the Admin — Other permissions tab.
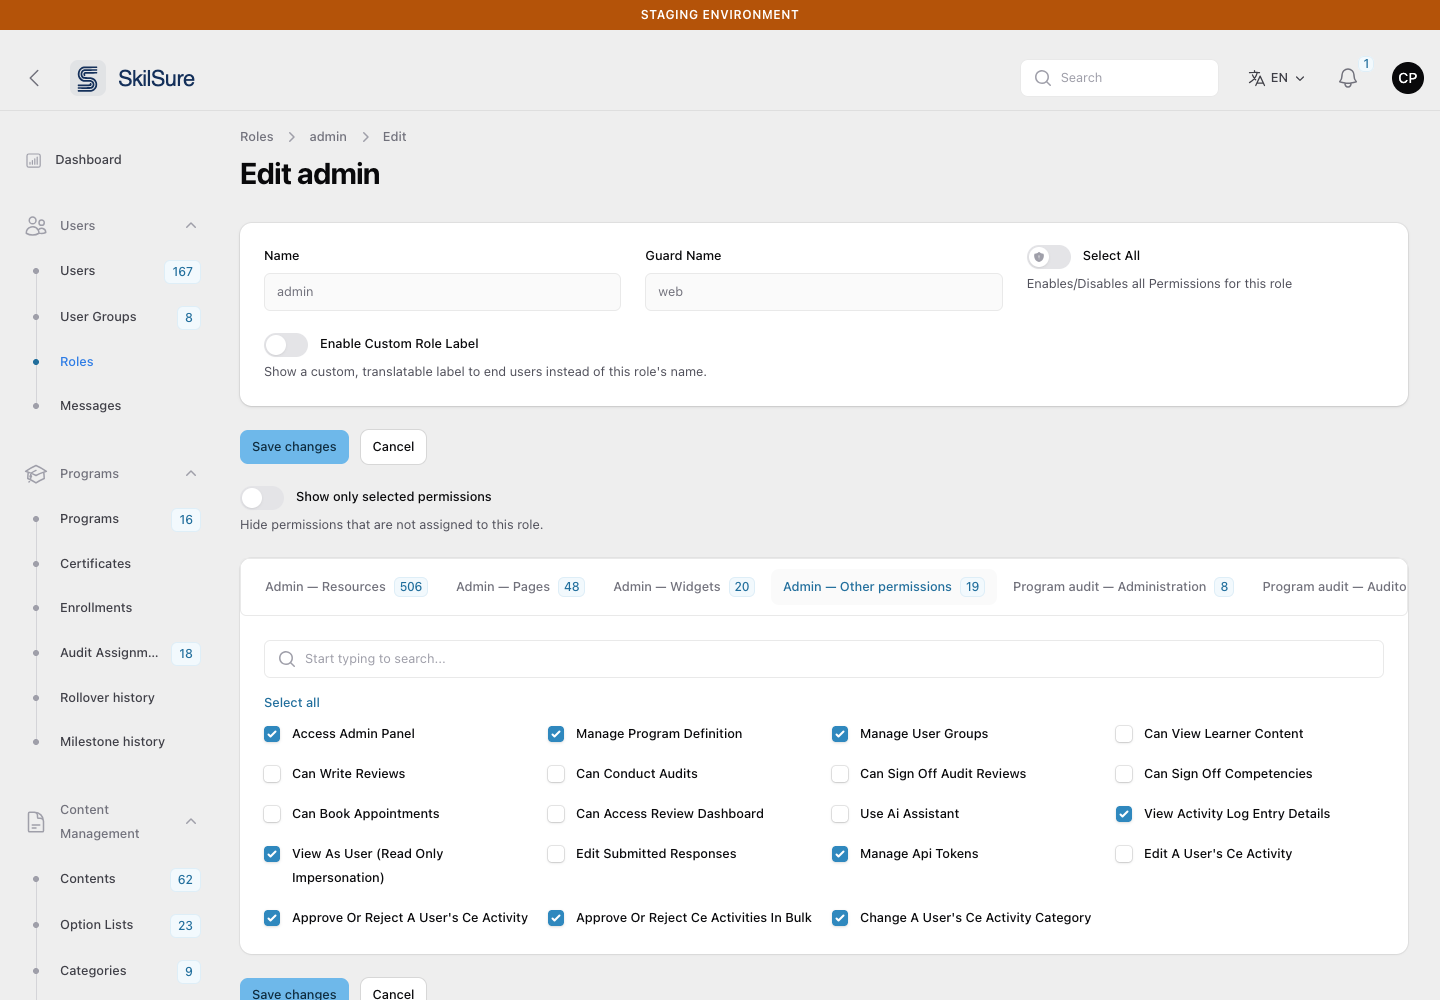 Users → Roles → edit a role → Admin — Other permissions. The three CE activity decision permissions sit beside Edit a User's CE Activity.
Edit a user's activity
Administrators whose role has the Edit a User's CE Activity permission can change the activity form on the Review Activity page and click Save Changes. Points and category are recalculated from the new answers, as when the user saves. The activity keeps its status, and an Edited entry is added to its Review History. You can then approve or reject the activity on the same page.
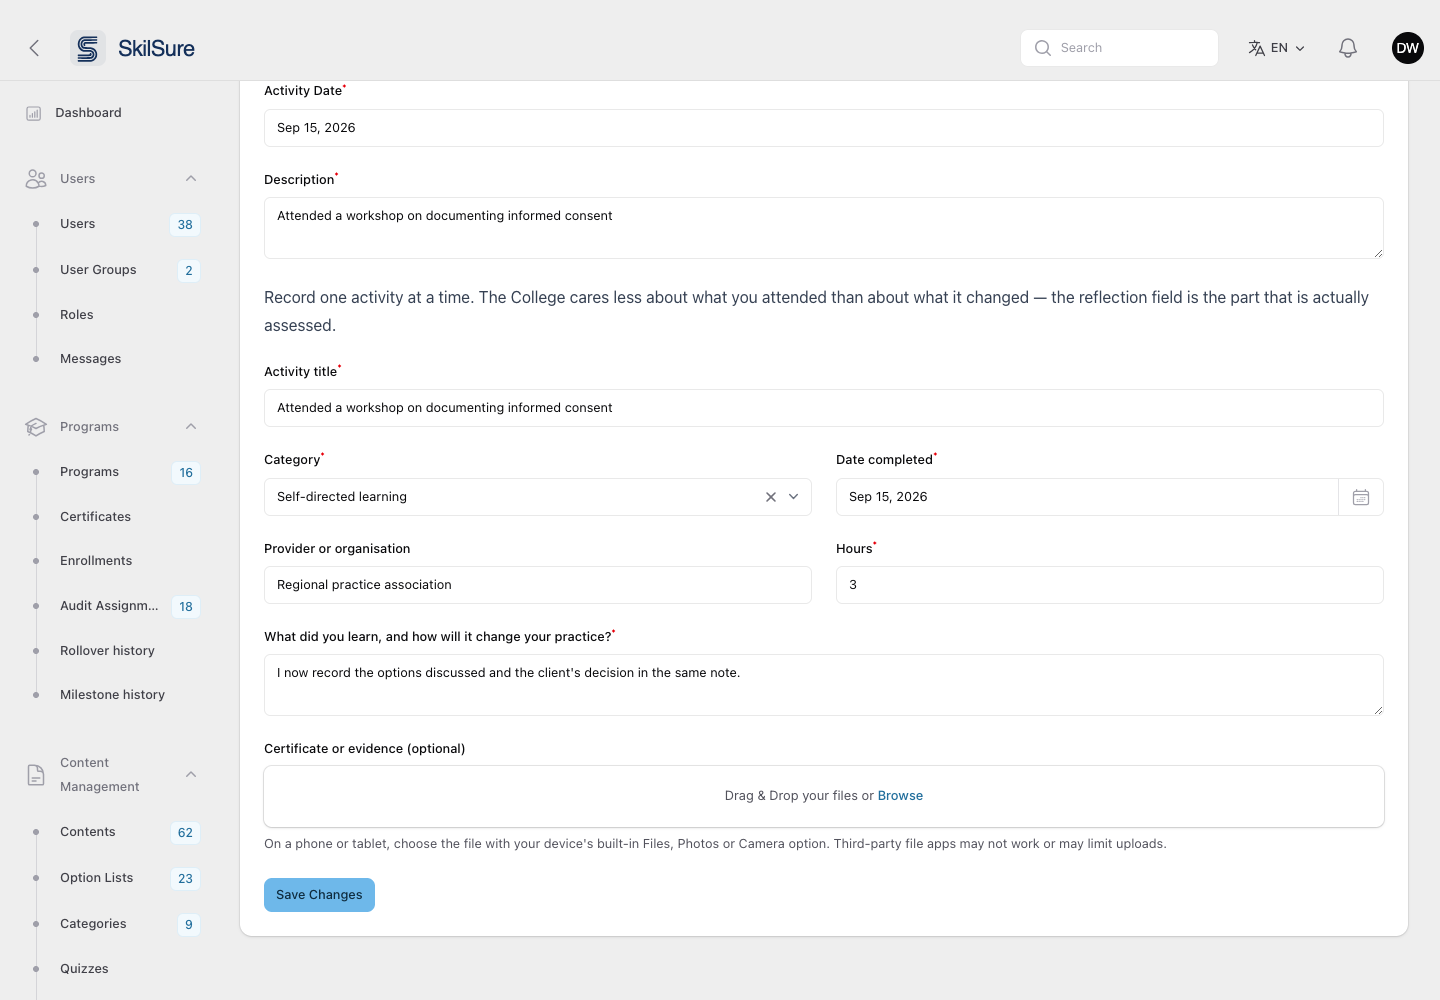 The Review Activity form for an administrator with Edit a User's CE Activity. Correct the answers, then click Save Changes.
Without the permission, the form is read-only and there is no Save Changes button. You can still approve, reject or change the category if your role has those permissions.
The permission is not granted by default
Edit a User's CE Activity is granted to no role, including Admin. To grant it, open Users → Roles, edit the role, and tick it on the Admin — Other permissions tab.
Another administrator decided first
If another administrator approves or rejects the activity while you have the Review Activity page open, your next action is not saved. You see This activity was already decided — your changes were not saved. and return to Activities Analytics.
How users are notified
When you decide or change a user's activity, the user gets a notification in the bell at the top of their pages. Its View Details link opens the Activities step the activity belongs to.
| Your action | What the user is told |
|---|---|
| Approve | The activity type and date were approved, with the points awarded. |
| Reject | The activity type and date were rejected, with your reason. |
| Change category | The old and new category, with your comment if you gave one. |
| Save Changes (edit) | An administrator corrected the activity, with its new points. Your edits are not listed. |
- Bulk approve and bulk reject send each user one summary, such as 3 activities approved, instead of one notification per activity. A bulk reject includes your reason.
- A Save that changes nothing sends nothing.
- Repeated edits are combined. While the user has not yet read the notification about an edit, further edits to the same activity update that notification instead of sending a new one. Once they have read it, your next edit notifies them again.
- Your own activities never notify you.
- If another administrator decided the activity first, your action is not saved and nobody is notified.
Also send an email
The bell notification is always sent. To email the user as well, open Settings → Notifications → Settings and turn on Email users when their CE activity is reviewed. It is off by default, and it only takes effect while Enable Notifications is on. A combined edit notification does not send a second email.
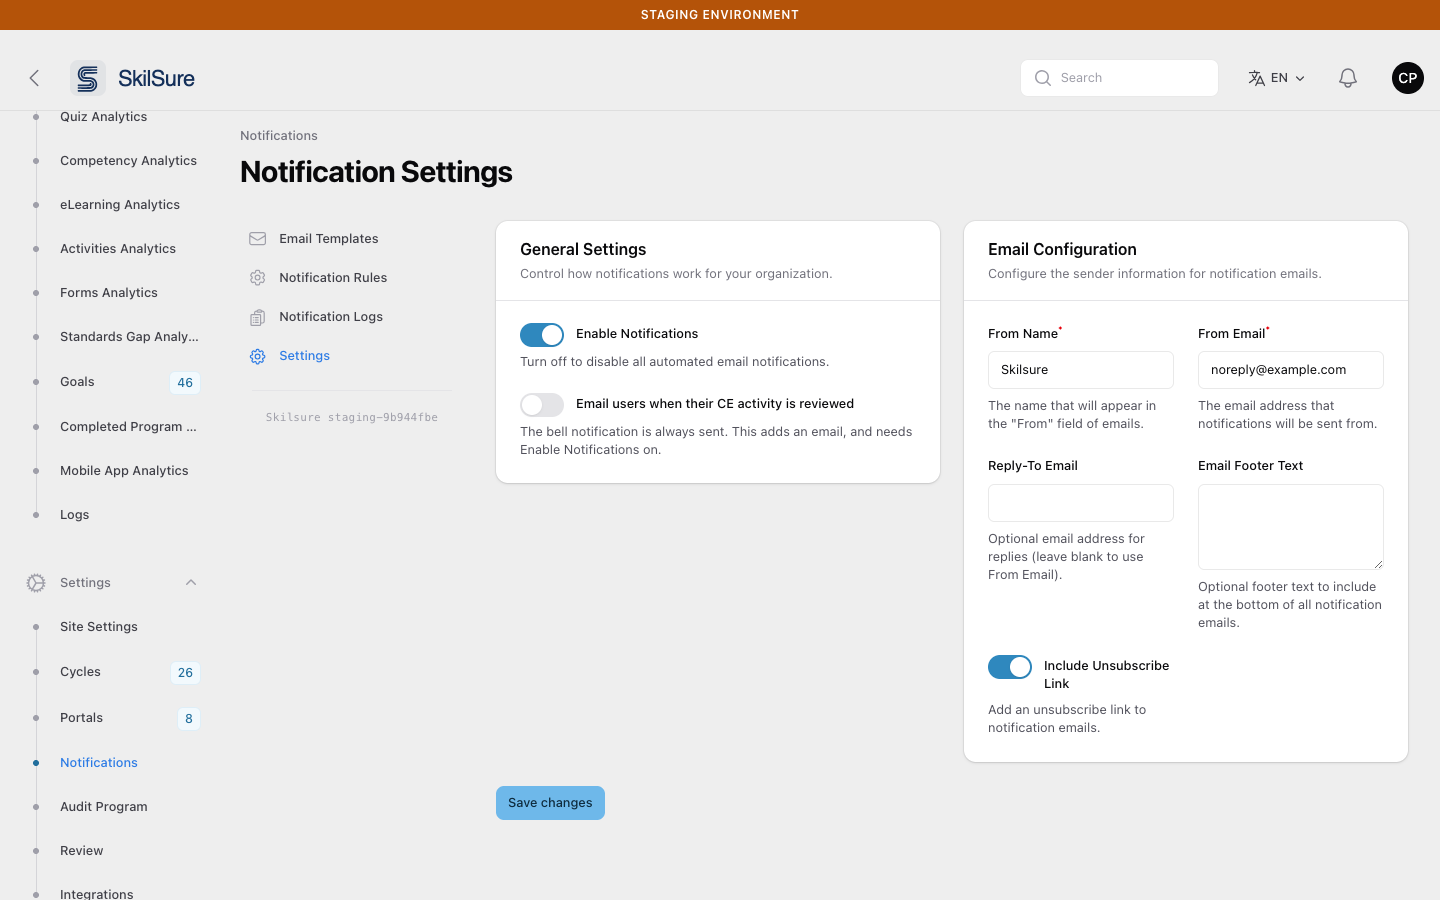 Settings → Notifications → Settings. The CE activity review email toggle sits under Enable Notifications.
Forms Analytics
Where the other dashboards count submissions, Forms Analytics looks inside them: pick one form and see how people answered each of its fields.
It covers every content type that embeds a form, so the Select Form list is grouped by where the form is used — Forms, Learning Portfolio (goal-phase forms), Activities, and Category Activities. Only forms that actually contain a field worth summarising are listed.
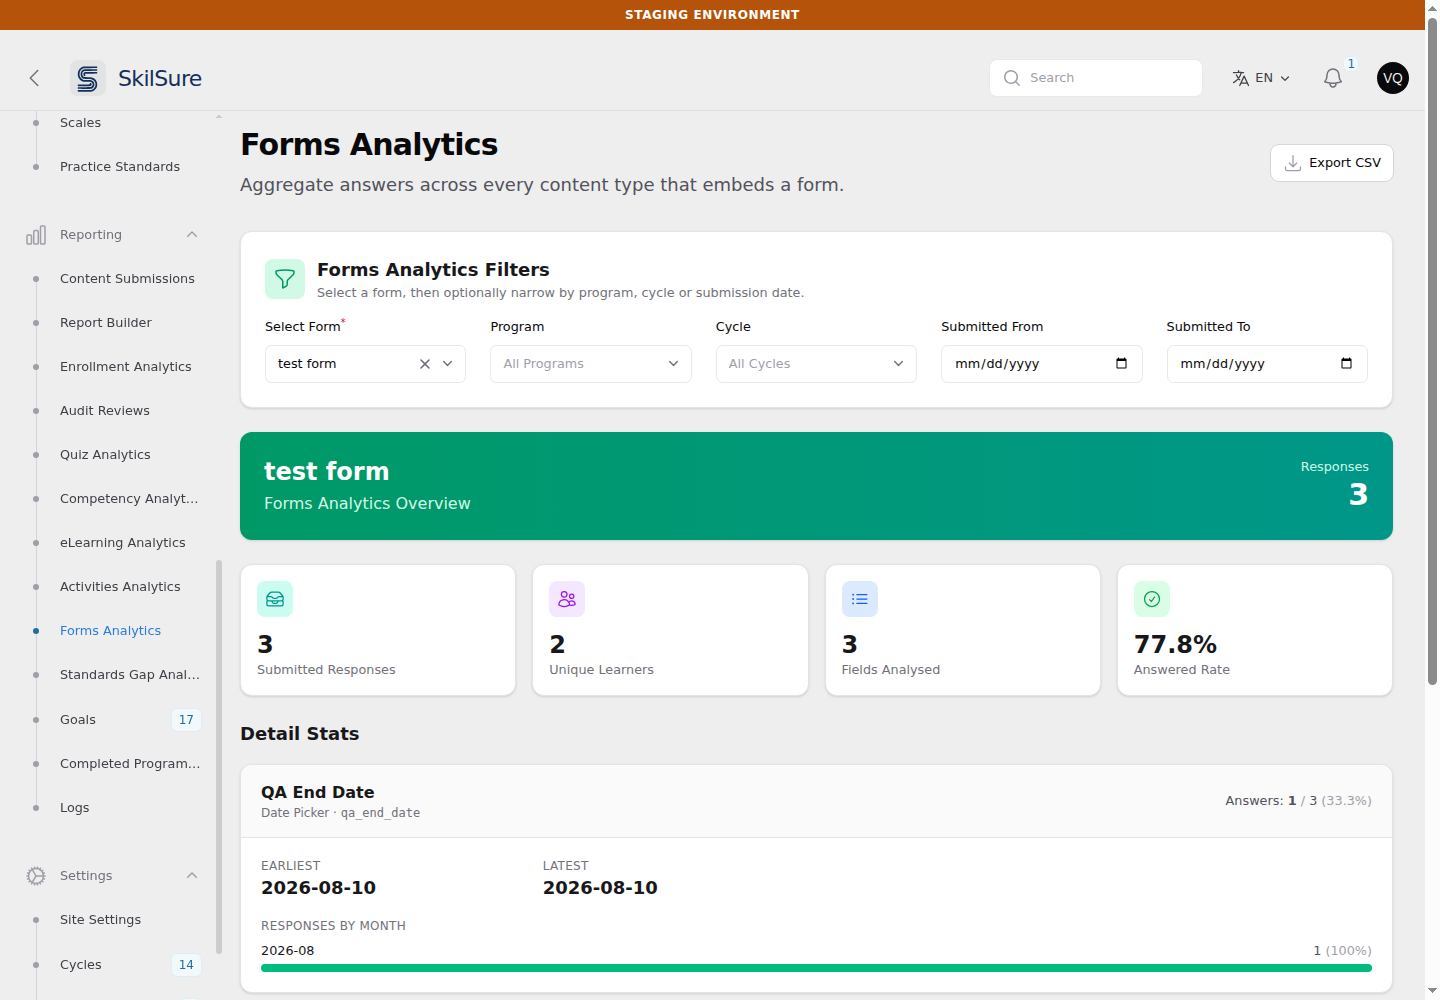 Forms Analytics. Choose a form, then optionally narrow by program, cycle, or the date the work was submitted.
The tiles across the top summarise the whole form:
- Submitted Responses — how many submissions are behind these numbers.
- Unique Learners — how many different people they came from. Someone who submitted twice counts once.
- Fields Analysed — how many of the form's fields this report can summarise.
- Answered Rate — across every response and every field, how often a field was actually filled in. Toggle Switch and Acknowledgement fields are left out of this figure; see the note below.
Below that, Detail Stats gives one card per field, with the figures that suit that field's type:
| Field type | What you get |
|---|---|
| Select Menu, Checkbox List, Radio List, Select Sub Menu, Toggle Switch, Acknowledgement | How many people chose each option, and what share of respondents that is |
| Work Hours | Count, average, median, standard deviation, minimum, and maximum — shown as hours and minutes, e.g. 4h 1m |
| Scale | A breakdown per rated item, plus point statistics across the whole scale |
| Date Picker | How many answered, the earliest and latest dates, and a count per month |
| File Upload | What share attached a file, the total number of files, and files per response |
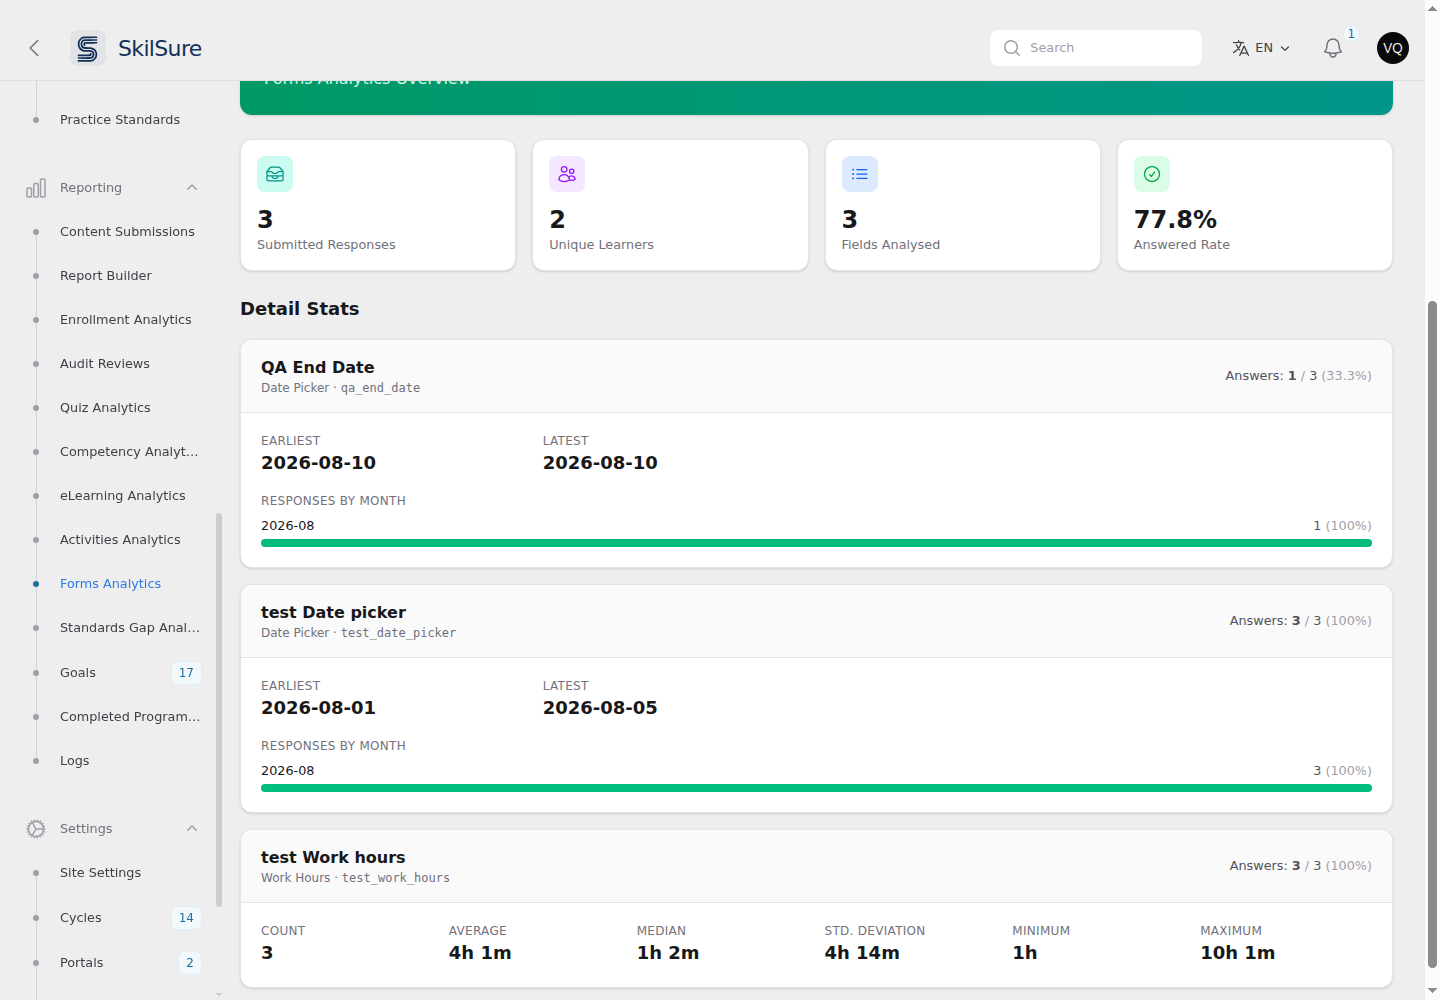 One card per field. Each card shows how many of the responses answered that field.
Export CSV downloads the same figures as one row per option or statistic, so you can pivot them in a spreadsheet.
Learning Portfolio forms count every entry
A user can add several activities or reflections to a single Learning Portfolio goal, and each one is its own response here — so a portfolio form usually shows more responses than it has goals or users. Entries an administrator has reset are left out.
Linked sub-forms are included
When a form's Select Menu or Radio List pulls in another form, the fields it brings in are part of the same form as far as the person filling it out is concerned — so they are counted here too, including any form those bring in themselves.
When several questions share one answer
Linked sub-forms often reuse the same field name. If eleven sub-forms each have a field called date, everything typed into any of them is stored in one place — so the report cannot tell "Session Date" apart from "Publication Date".
Rather than repeat the same numbers under each prompt, you get one card per answer, listing every prompt that writes to it and saying plainly that the figures cover them together.
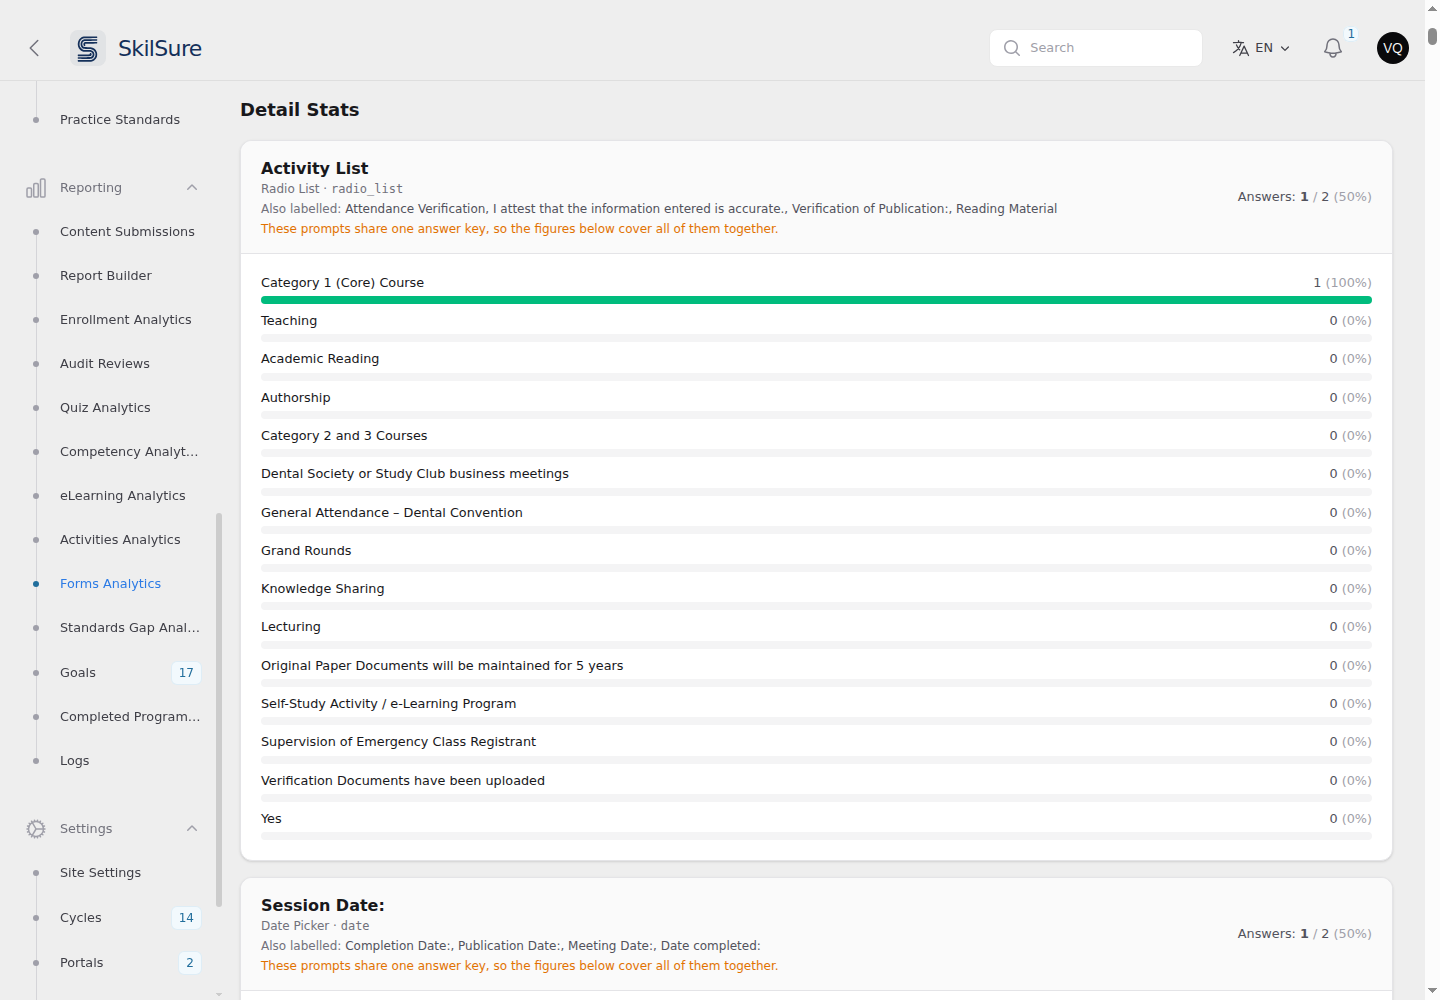 One card per answer, naming every question that feeds it.
Fields Analysed counts answers, not prompts, so it can be lower than the number of fields you see in the builder. The CSV carries the same information in a Shared With column.
If you want these questions reported separately, give each one its own field name in the form builder. :::
While the report is working
A form with a lot of submissions takes a moment to add up. A "Crunching the responses…" banner appears while that happens. The rest of the page stays usable — you can still move around the admin while it finishes.
Field names follow your language
If a form has been translated, its field labels appear here in your admin language, matching what the person filling it out was shown. The figures are the same either way — only the labels change.
What counts as a response
Only submitted work is counted. Drafts and in-progress entries are left out, and so is any earlier version of a submission the person has since redone or that an administrator has reopened — otherwise one person revisiting a form would look like several.
A field counts as answered only when something was actually entered. So a form can show many responses and a very low Answered Rate if those submissions were created in bulk — by an import, say — rather than filled in by hand. Open one of them from Content Submissions to see what it holds: if it looks empty there, it is empty, and the report is showing you that correctly.
Percentages over 100%
On a field where people may pick more than one option, each option's percentage is of the people who answered — so they can add up to more than 100%. The card says so when that applies.
Toggle switches and "No"
A switch the person never touched is saved the same way as one they deliberately turned off, so both are counted as No. There is no way to tell them apart after the fact.
Because of that, a toggle is always "answered" by everybody, which tells you nothing about how many people engaged with it — so Toggle Switch and Acknowledgement fields are left out of the overall Answered Rate. Their Yes/No bars still show exactly what was saved, and each card repeats this note.
Report Builder — custom reports
When the pre-built dashboards aren't enough, build your own. Every report starts with a Report Type, chosen from a radio with a short description under each option:
- Analytics — a single data source rendered as a table, with optional charts (the classic builder, covered below).
- Cycle roster — one row per member enrollment in a program cycle.
- Aggregate summary — a cross-member distribution of a form's answers across the cycle.
Cycle reports
Cycle roster and Aggregate summary anchor to a program and cycle and discover their columns from it. See Cycle reports — rosters & aggregates for building, viewing, and scheduling those.
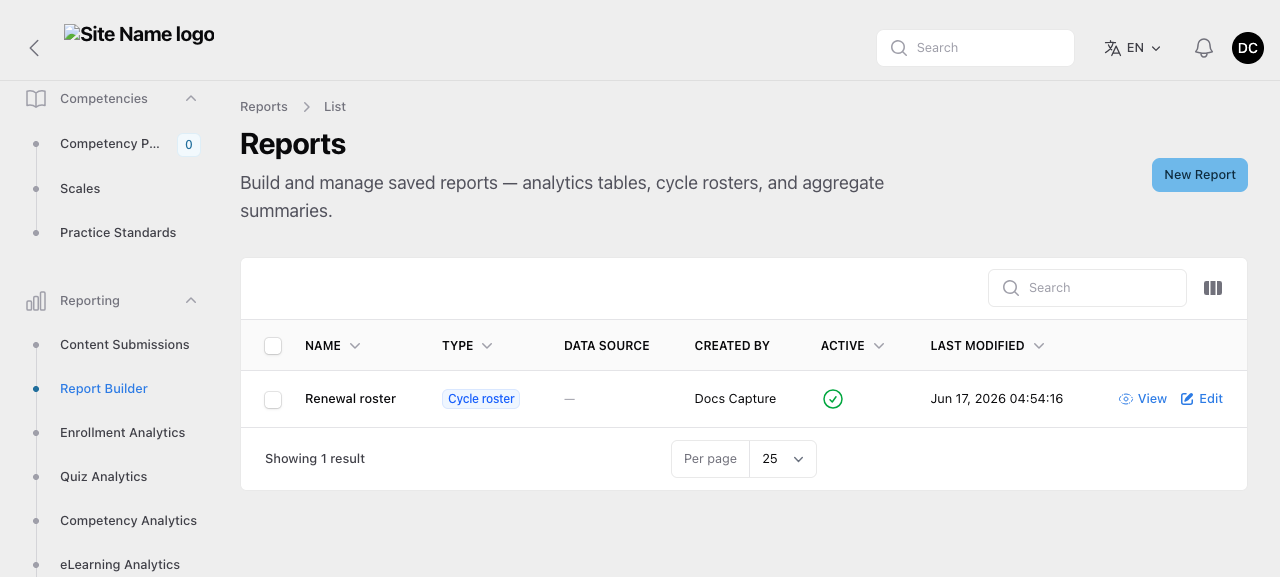 The Reports list. The Type column shows each report's shape; clicking a row opens it for viewing. Data Source applies only to Analytics reports.
Analytics reports
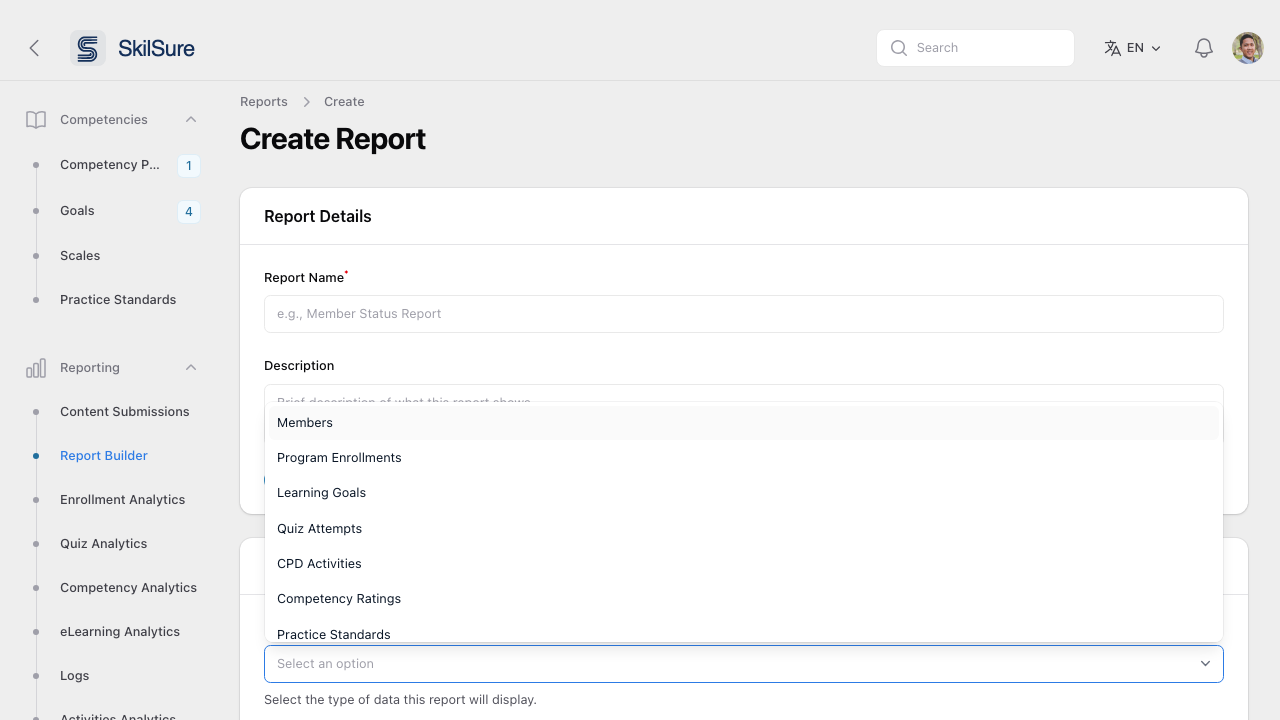 For an Analytics report, pick a Data Source — each brings its own column set.
The available data sources cover most reporting needs:
- Members — user records and profile data.
- Program Enrollments — every enrollment with its status and dates.
- Learning Goals — competency goals set by or for users.
- Quiz Attempts — individual attempts and scores.
- CPD Activities — continuing professional development activity submissions.
- Competency Ratings — competency scores from rating steps.
- Practice Standards — practice-standard data.
- Content Submissions — every submission record.
- Click New Report on the Reports list.
- Name the report and set Report Type to Analytics.
- Pick a Data Source and the columns to include.
- Save. The report is then available to view and export.
Standards Gap Analysis
A focused view that compares Practice Standards against what users have actually covered.
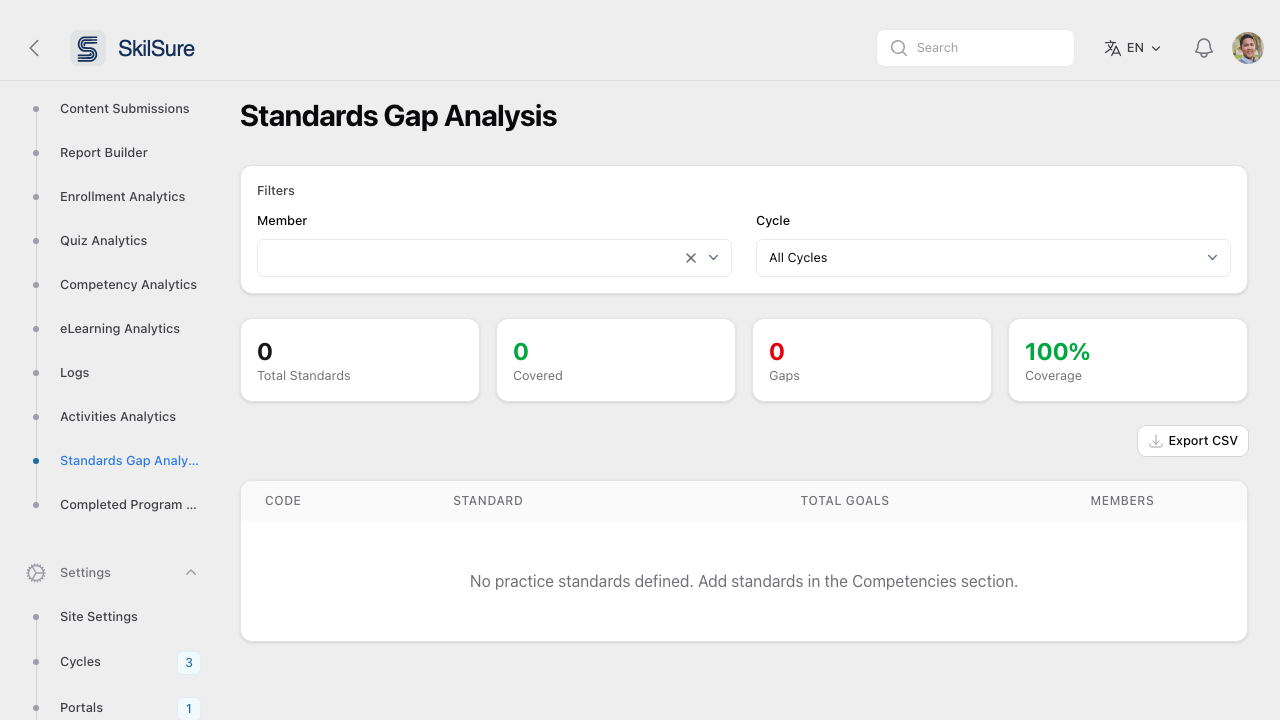 Standards Gap Analysis. Total Standards, Covered, Gaps, and Coverage % at the top; a per-standard breakdown below.
- Filter by Member and Cycle.
- The KPI strip shows total standards, how many are covered by the user's program activity, how many are gaps, and overall coverage.
- The table below itemises each standard with its code, total goals, and members it applies to.
- Export CSV for sharing or audit.
Prerequisite
This view depends on Practice Standards being defined under Competencies → Practice Standards. Without standards, the page shows zero coverage.
Logs
An audit trail across three log types — useful for support, security review, and onboarding troubleshooting.
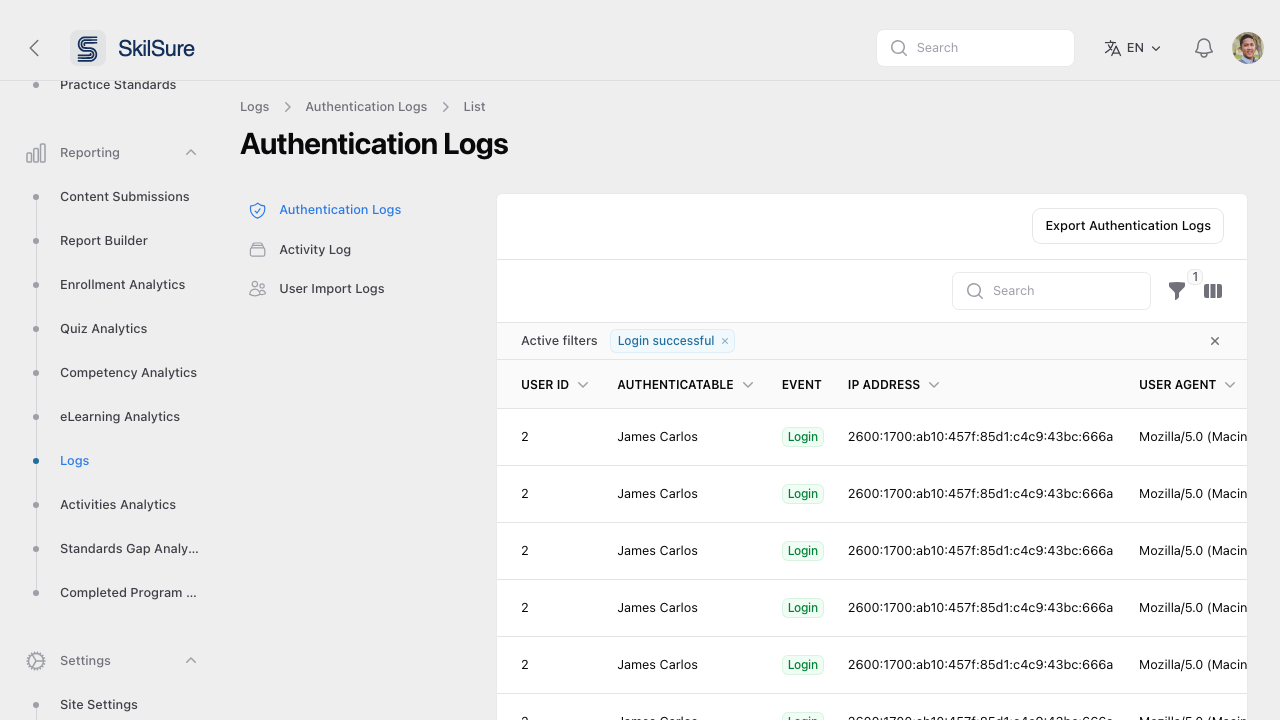 Logs → Authentication Logs. The left rail switches between Authentication, Activity, and User Import logs.
- Authentication Logs — every successful and failed sign-in, with user, IP, user agent, and event type.
- Activity Log — record of admin actions across the tenant.
- User Import Logs — outcomes of bulk user imports.
Completed Program Auto-selection & Export
Batch-pick a random or rule-based sample of completed enrollments and export them — typically used for compliance audits and randomised reviews.
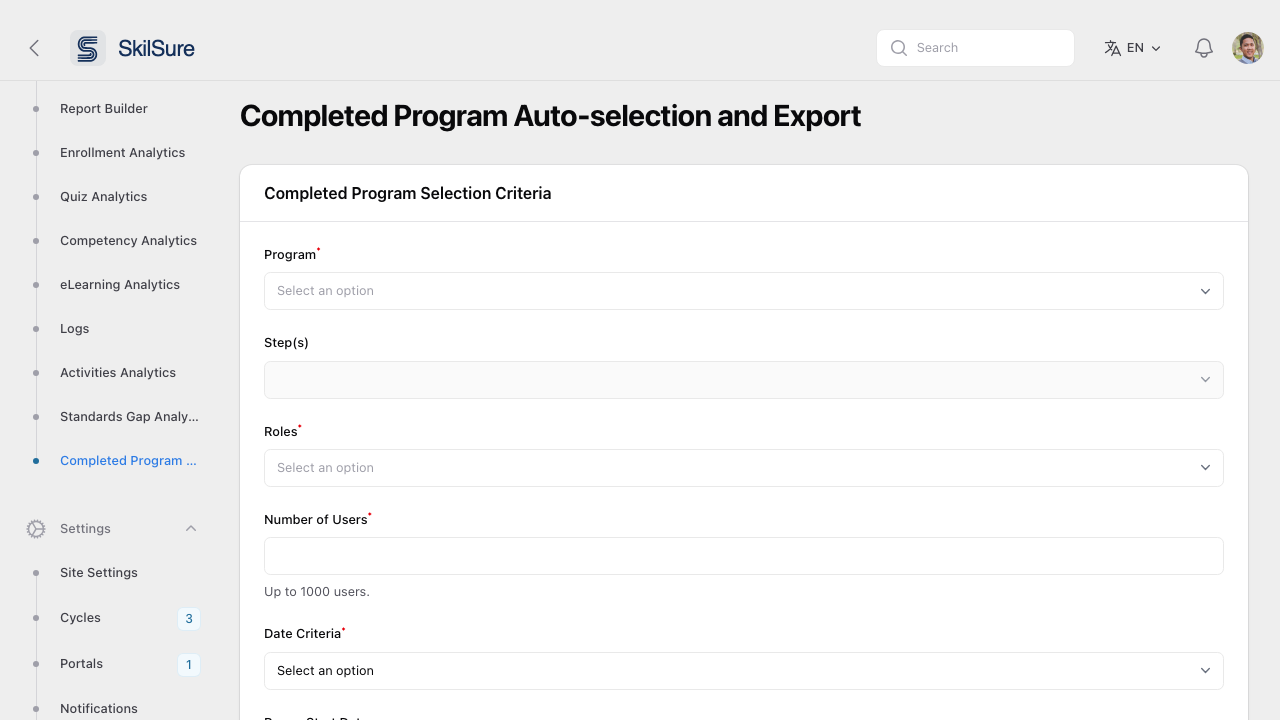 Completed Program Auto-selection. Define the selection criteria; SkilSure picks the matching set and exports it.
- Pick the Program and (optionally) specific Step(s) to scope the selection.
- Choose which Roles should be considered.
- Enter Number of Users (up to 1,000).
- Pick the Date Criteria — cycle start, cycle deadline, or enrollment completion — and a date range.
- Optionally toggle Skip in-progress content submissions to keep the export clean.
- Save the selection and trigger the export.
Manage your selections
Saved selections are listed below the form, each with View, Export, Download Export, and Delete actions.
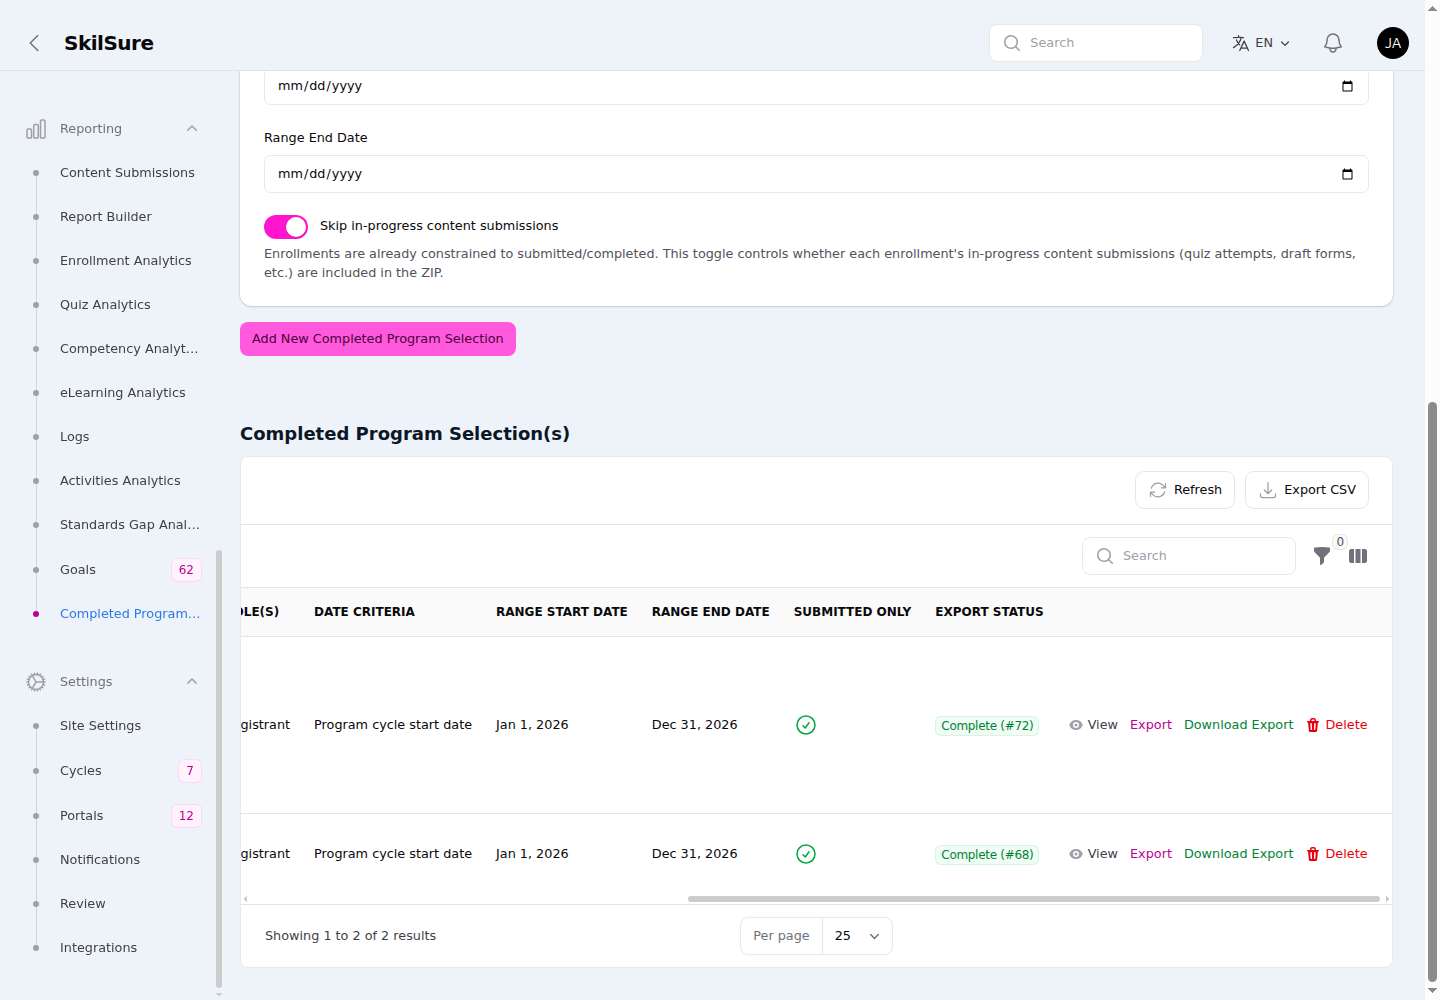 Completed Program Selection(s). Delete is always available — even while an export is still running.
- Delete is always shown and enabled, even when an export for that selection is still queued or running. Deleting cleans up the selection and any export files it produced.
- Exports of Learning Portfolio and Activities steps mirror what the user sees — the goal/activity tables (including custom columns) and the completion, form, and period rules — across the export PDF and CSV.
The export ZIP is named audit_select_{selection}_{export}_{date-time}.zip and organises evidence into a user / program / cycle / step / goal folder hierarchy (folder names are shortened and de-duplicated so two entities can't collide, and a resumed export retry reuses the same names). Each learning-portfolio step also gets a goal summary (goals_summary.csv / .pdf) that opens with a header block — Program, Cycle, Step, User, Member Number, and Export Date — followed by the Completion Requirements, Form Completion Rules, and Period Completion Rules (each only when configured) and a Summary Table of the goals: a Goal ID and a row number prepended to the Status / Name / Files columns, plus any custom columns. When the table is too wide for the page, the PDF lists each goal as a key-value block instead.